
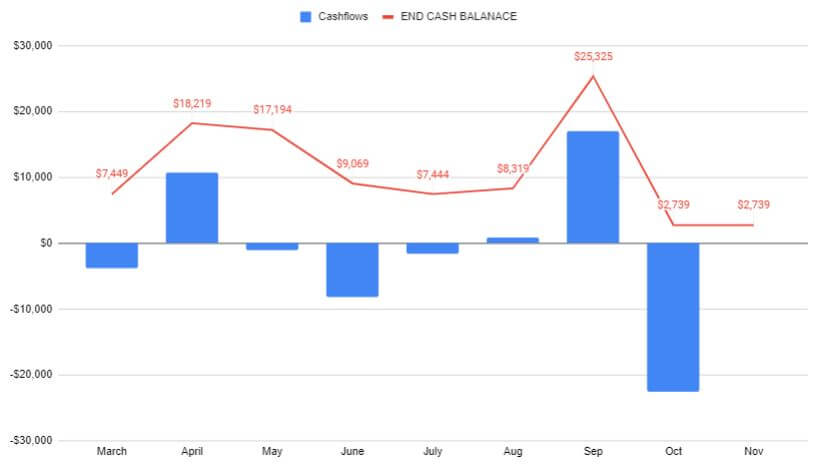
Cash flow diagrams help people visualize the inflows and outflows of cash transactions.
By mapping out inflows and outflows over time, a cash flow diagram can provide more clarity on how money is moving in and out of an account.
Contents
- What are cash flow diagrams?
- Components of a cash flow diagram
- Analyzing cash flow diagrams
What are cash flow diagrams?
Cash flow diagrams are a way to visualize cash flow over a specified period of time.
They display the timing and volume of cash inflows and outflows for any kind of financial activity.
Components of a cash flow diagram:
Time Intervals
Time intervals are a major component of these diagrams and choosing the right interval will depend on your situation.

Cash Inflows
Inflows represent the cash flowing into the bank account during each time interval.
Some examples of inflows are:
- Income
- Tax Refunds
- Sales Revenue
- Loan proceeds
- Investment returns
- Seed money from your investors
- A bag of money found on your front porch
Or, any other source of cash coming into the bank account.
Cash Outflows
On the other side of the equation, the outflows would be the cash coming out of the bank account over time.
Some examples of outflows are:
- Taxes
- Payroll
- Supplies
- Equipment
- Overhead costs, like rent or utilities
- Loan principal and interest payments
Or, any other source of cash coming into the bank account.
Analyzing cash flow diagrams
There are two primary ways of looking at the results of this diagram: net cash flow and cumulative cash flow.
Net cash flow

The net cash flow looks at total inflows minus total outflows for a specific interval.
This is helpful in determining a surplus and deficit for a specific period of time.
Cumulative cash flow
The cumulative cash flow looks at the sum of the net cash flows over each cash flow period.

This helps track the total excess of the deficit.
There can be times when net cash flow is negative for an interval, but the total cash flow is positive, or vice versa.
This is why we look at both net and cumulative cash flow.
Financial modeling software can help you create diagrams like these, and more, for your startup. Check out our article here for our favorites.
